Welcome to the Knowledge Communication Gallery. In this section we
showcase a few of the knowledge visualizations that we have developed
to facilitate knowledge communication among experts and decision makers.
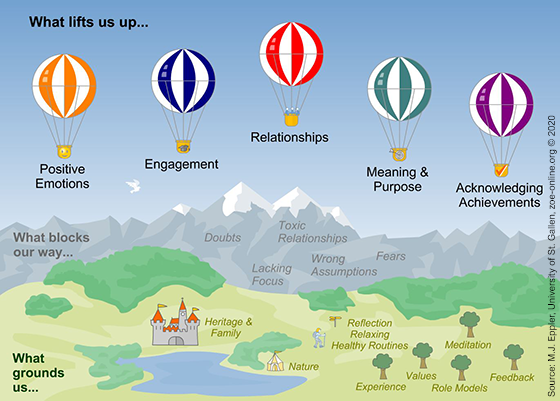
Visualization of the month
Video of the month
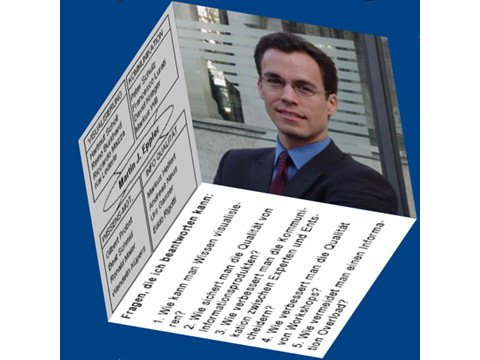
Presentation of the month
Martin Eppler gives a lecture on the Science and Practice of Team Creativity at Simon Fraser University in Vancouver (Canada).
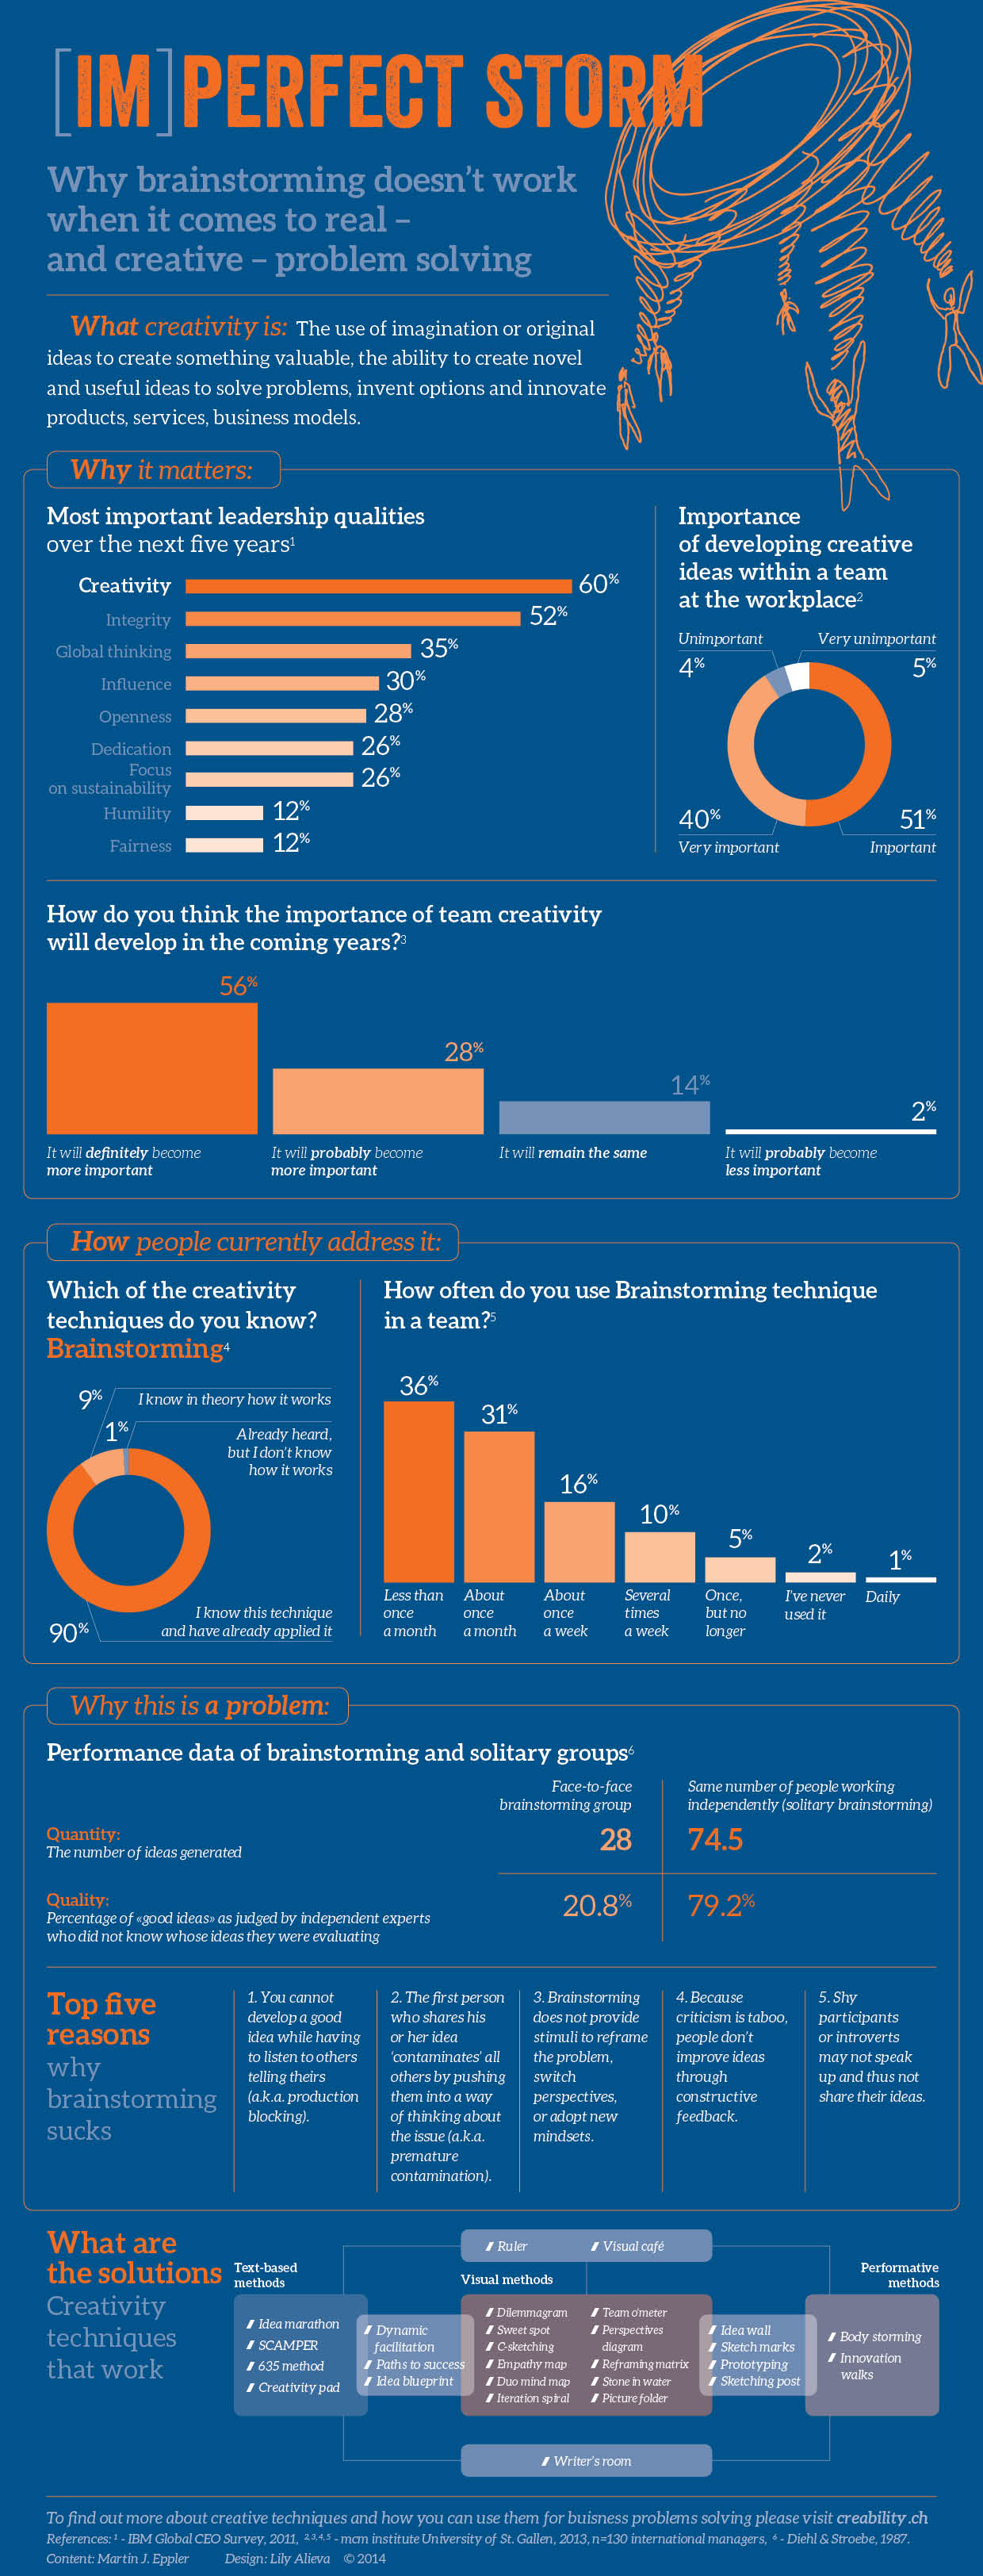
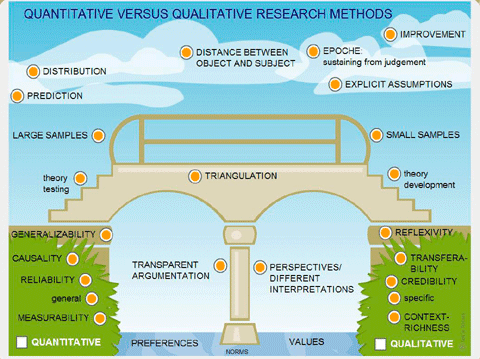
Infographic of the month
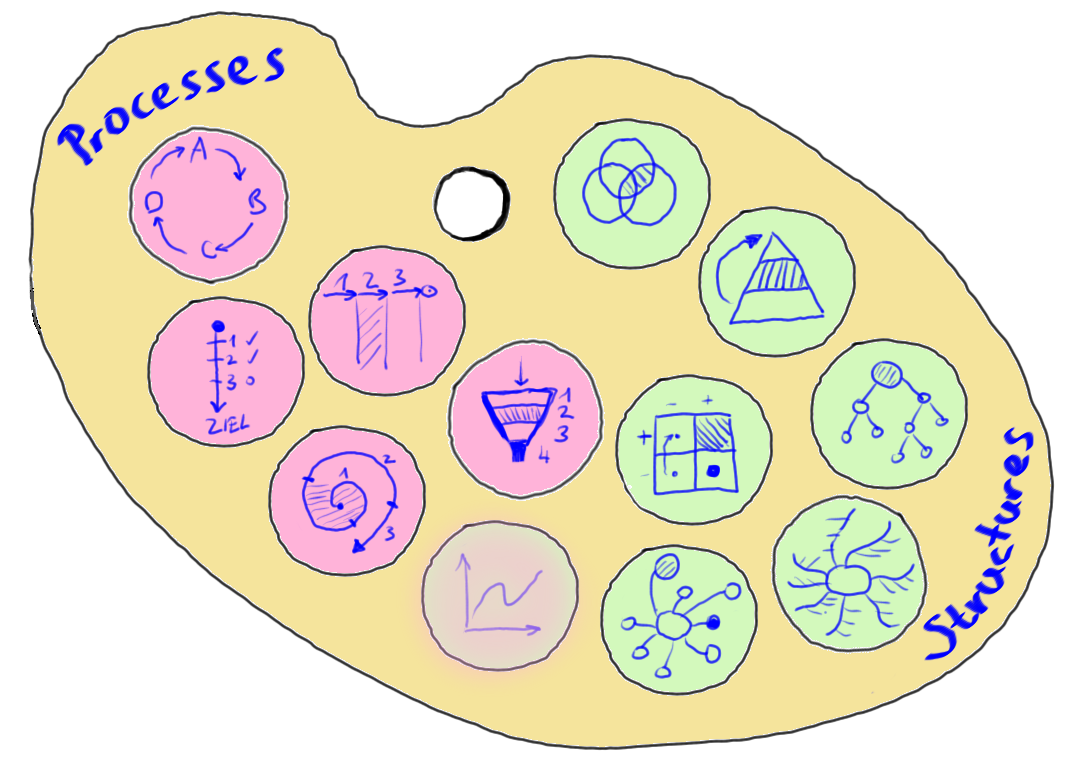
Mapping
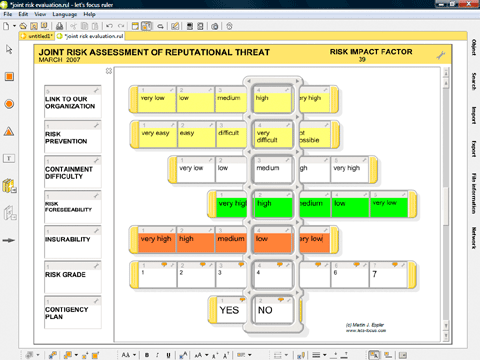
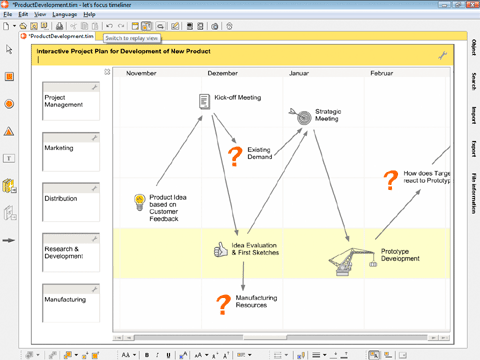
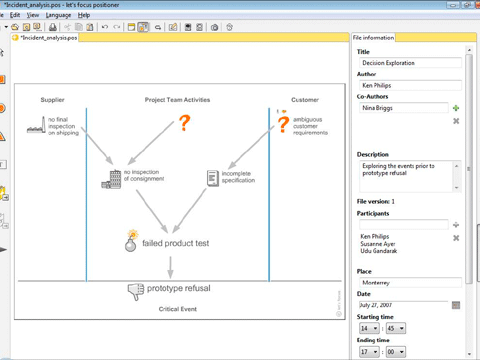
Diagramming
Sketching
Metaphorizing
Exploring
Narrating
Expressing
Sculpting
Spatializing
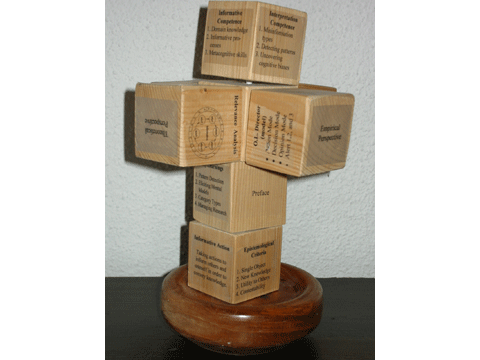
Competence Visualizations
For a collection of organizational competence visualizations, please
download this
document.
Competence visualizations may assist practitioners in identifying,
managing, and communicating organizational competences.
Visual Solutions for Business Model Innovation
For a compilation of visual solutions for business model innovation, please download this document.
Visual frameworks may assist practitioners in overcoming the challenges of the business model innovation process.